-
Select the time range, level and reporting template.
-
Click Update to fetch the data into the table.
-
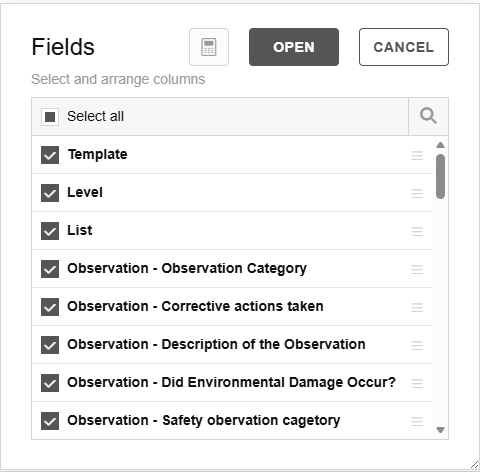
Using the Fields button, you can choose which fields you want to display in the list.
-
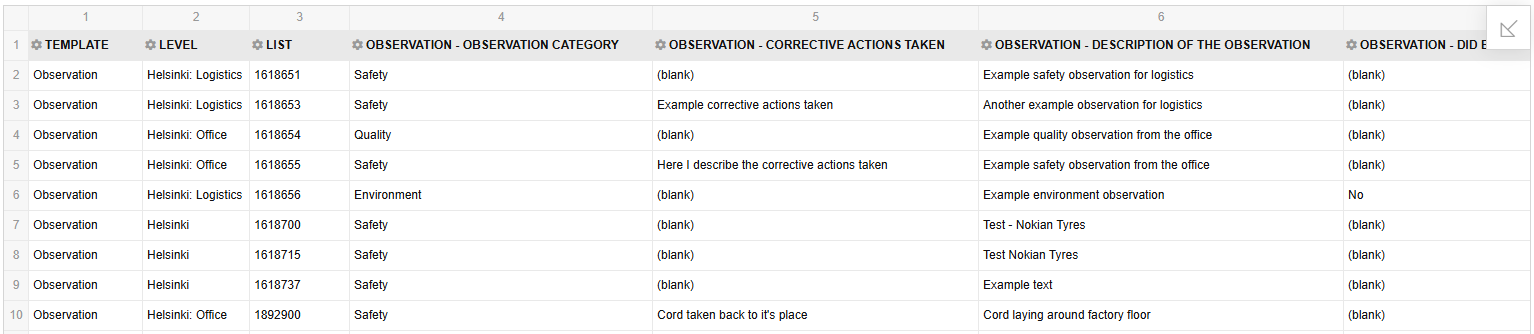
All selected data is loaded into the table, and you can, for example, export it to Excel for further processing using the EXPORT button.
-
Remember to save the filter for future use
Tips
-
You can highlight numeric values to calculate: total sum, count and average.
-
The data can also be exported to Excel for further processing.